dashboard
This is the real time statistics dashboard for the current system, press
Ctrl+Cto exit.
When running in Apache Tomcat Alibaba edition, the dashboard will also present the real time statistics of the tomcat, including QPS, RT, error counts, and thread pool, etc.
Options
| Name | Specification |
|---|---|
| [i:] | The interval (in ms) between two executions, default is 5000 ms. |
| [n:] | The number of times this command will be executed. |
Usage
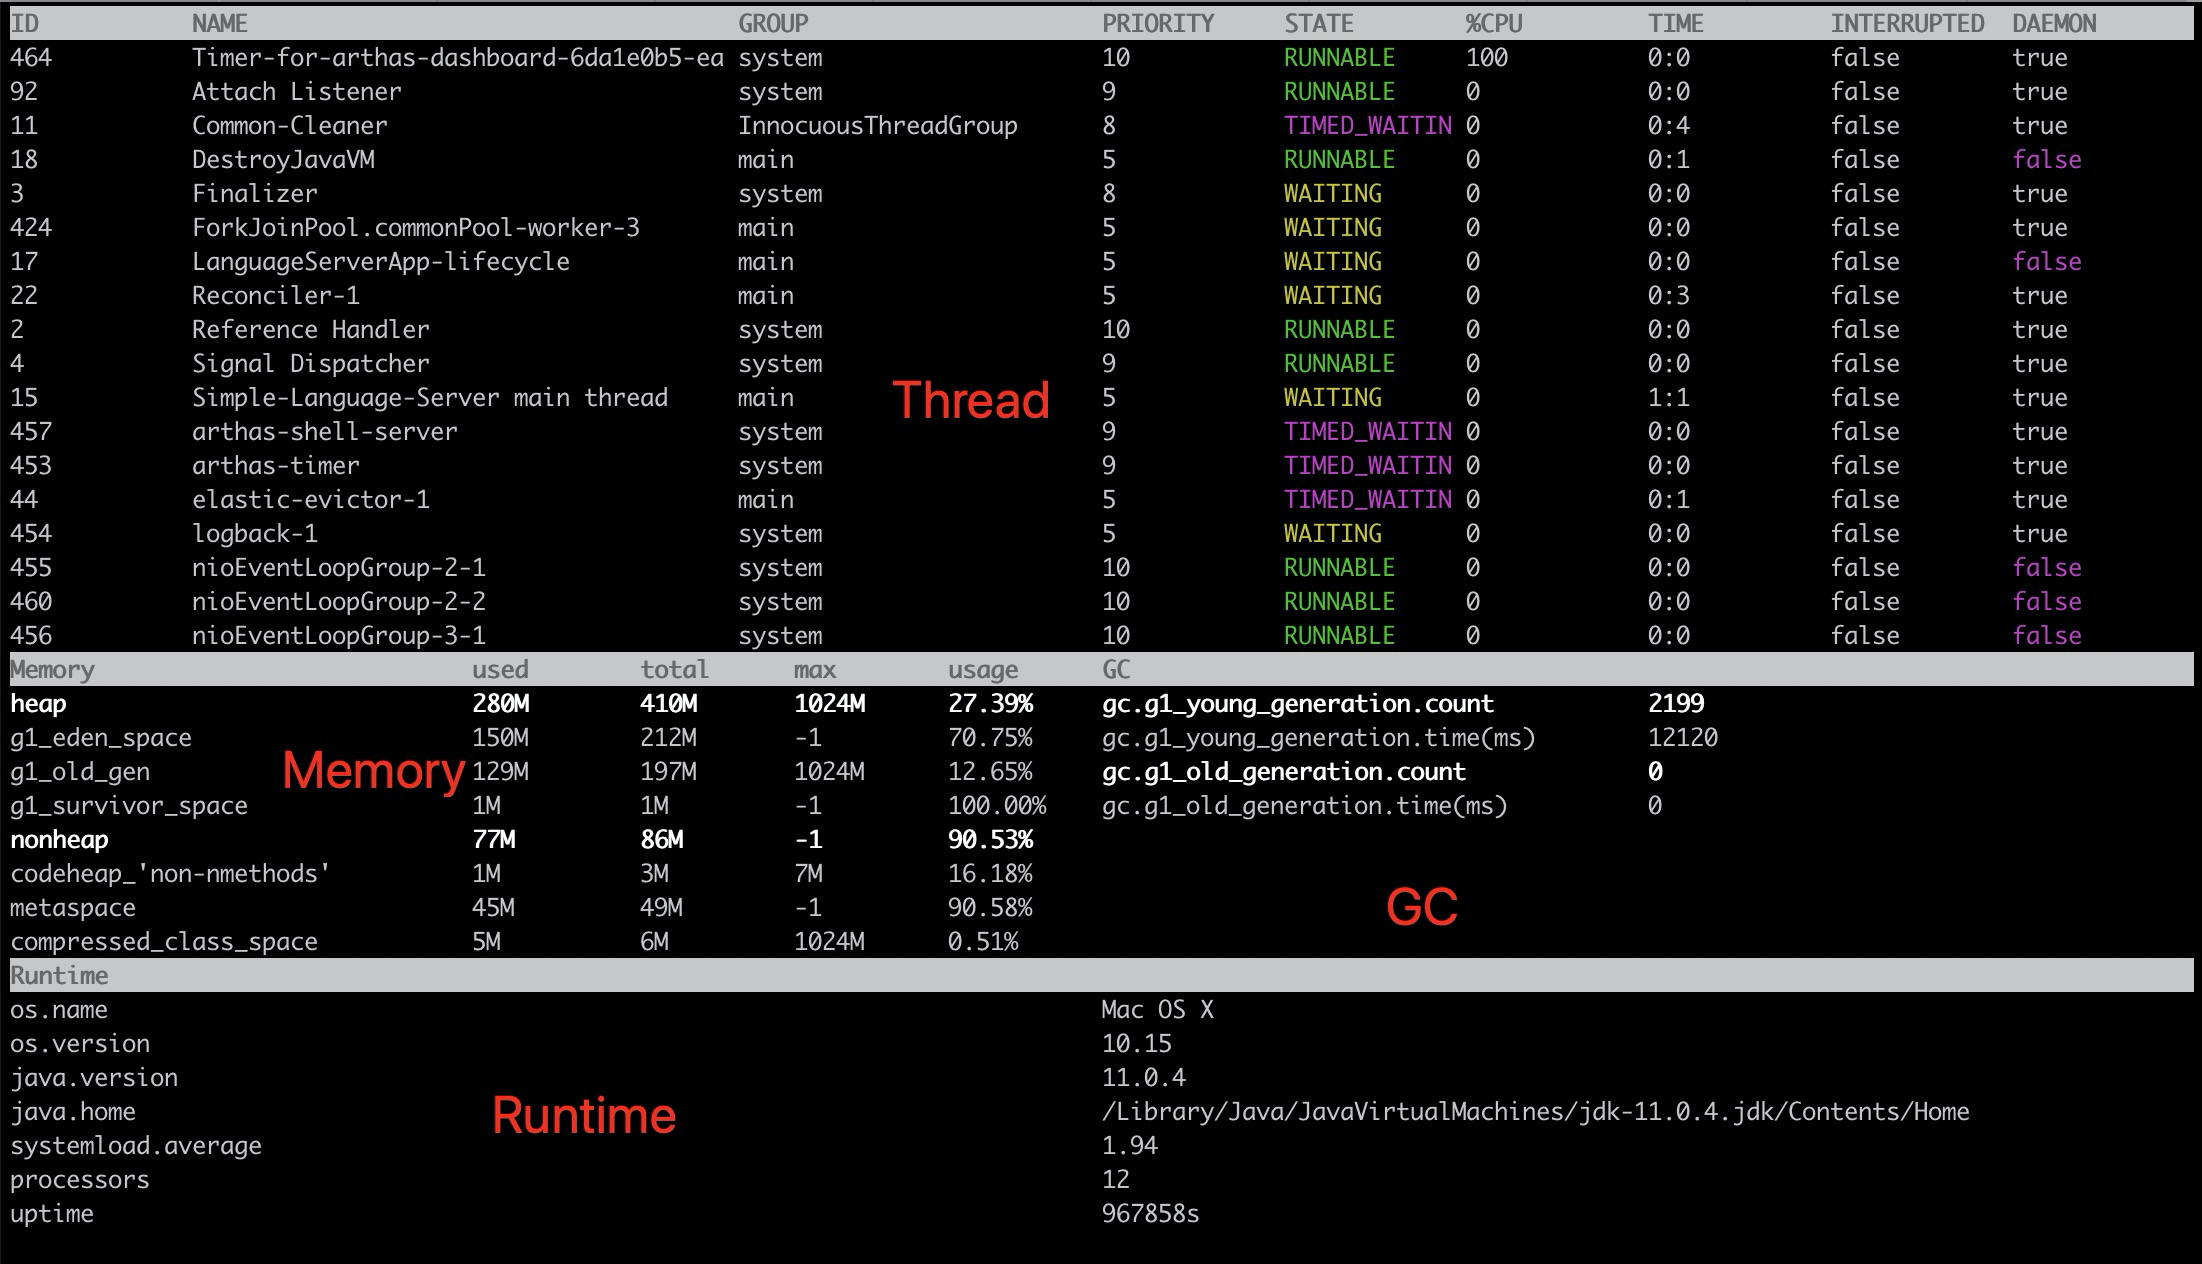
$ dashboard
ID         NAME                              GROUP                  PRIORITY   STATE       %CPU       TIME       INTERRUPTED DAEMON
889        RMI TCP Connection(15)-30.10.166. RMI Runtime            9          RUNNABLE    48         0:5        false       true
1077       Timer-for-arthas-dashboard-0      system                 9          RUNNABLE    24         0:0        false       true
1074       as-selector-daemon                system                 9          RUNNABLE    12         0:0        false       true
284        JMX server connection timeout 284 RMI Runtime            9          TIMED_WAITI 8          0:3        false       true
16         Timer-1                           main                   5          TIMED_WAITI 5          0:9        false       true
47         Pandora pandora-qos-reporter Pool main                   5          TIMED_WAITI 0          0:0        false       true
48         JmonitorClient-CheckThread Pool [ main                   5          TIMED_WAITI 0          0:0        false       true
49         JmonitorClient-HeartBeat Pool [Th main                   5          TIMED_WAITI 0          0:0        false       true
50         JmonitorClient-ReaderThread Pool  main                   5          TIMED_WAITI 0          0:0        false       true
957        RMI TCP Connection(16)-30.10.166. RMI Runtime            9          RUNNABLE    0          0:2        false       true
51         JmonitorClient-WriterThread Pool  main                   5          TIMED_WAITI 0          0:0        false       true
52         ContainerBackgroundProcessor[Stan main                   5          TIMED_WAITI 0          0:0        false       true
53         http-bio-8080-Acceptor-0          main                   5          RUNNABLE    0          0:2        false       true
54         http-bio-8080-AsyncTimeout        main                   5          TIMED_WAITI 0          0:0        false       true
11         GC Daemon                         system                 2          TIMED_WAITI 0          0:0        false       true
Memory                       used      total     max      usage     GC
heap                         59M       223M      1820M    3.26%     gc.ps_scavenge.count              118
ps_eden_space                14M       114M      668M     2.11%     gc.ps_scavenge.time(ms)           1890
ps_survivor_space            6M        6M        6M       96.08%    gc.ps_marksweep.count             5
ps_old_gen                   39M       103M      1365M    2.86%     gc.ps_marksweep.time(ms)          1140
nonheap                      234M      240M      0M       97.46%
code_cache                   46M       47M       240M     19.49%
metaspace                    167M      172M      0M       97.36%
Runtime                                                             Tomcat
os.name                           Mac OS X                          connector                         http-bio-8080
os.version                        10.10.5                           QPS                               0.00
java.version                      1.8.0_60                          RT(ms)                            1.13
java.home                                                           error/s                           0.00
                                                                    received/s                        0B
systemload.average                3.44                              sent/s                            0B
processors                        4                                 threadpool                        http-bio-8080
uptime                            16020s                            busy                              0
Notes on column headers
ID: JVM thread ID, pls. note this ID is different from the nativeID in jstack
NAME: thread name
GROUP: thread group name
PRIORITY: thread priority, ranged from 1 to 10. The greater number, the higher priority
STATE: thread state
CPU%: the ratio of CPU usage for the thread, sampled every 100ms
TIME: total running time in
minute:secondformatINTERRUPTED: the thread interruption state
DAEMON: daemon thread or not
Screenshot