dashboard
This is the realtime dashboard for the system; press Ctrl+C to exit.
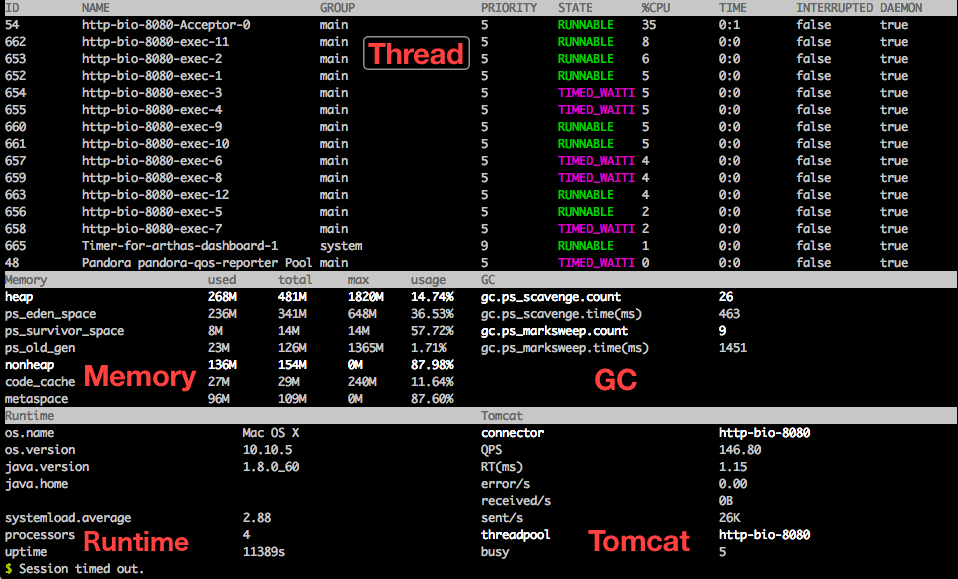
When running in Ali-tomcat, the dashboard will present the realtime statistics of the tomcat including QPS, RT, error counts, thread profile and the like.
A Demo
$ dashboard
ID         NAME                              GROUP                  PRIORITY   STATE       %CPU       TIME       INTERRUPTED DAEMON
889        RMI TCP Connection(15)-30.10.166. RMI Runtime            9          RUNNABLE    48         0:5        false       true
1077       Timer-for-arthas-dashboard-0      system                 9          RUNNABLE    24         0:0        false       true
1074       as-selector-daemon                system                 9          RUNNABLE    12         0:0        false       true
284        JMX server connection timeout 284 RMI Runtime            9          TIMED_WAITI 8          0:3        false       true
16         Timer-1                           main                   5          TIMED_WAITI 5          0:9        false       true
47         Pandora pandora-qos-reporter Pool main                   5          TIMED_WAITI 0          0:0        false       true
48         JmonitorClient-CheckThread Pool [ main                   5          TIMED_WAITI 0          0:0        false       true
49         JmonitorClient-HeartBeat Pool [Th main                   5          TIMED_WAITI 0          0:0        false       true
50         JmonitorClient-ReaderThread Pool  main                   5          TIMED_WAITI 0          0:0        false       true
957        RMI TCP Connection(16)-30.10.166. RMI Runtime            9          RUNNABLE    0          0:2        false       true
51         JmonitorClient-WriterThread Pool  main                   5          TIMED_WAITI 0          0:0        false       true
52         ContainerBackgroundProcessor[Stan main                   5          TIMED_WAITI 0          0:0        false       true
53         http-bio-8080-Acceptor-0          main                   5          RUNNABLE    0          0:2        false       true
54         http-bio-8080-AsyncTimeout        main                   5          TIMED_WAITI 0          0:0        false       true
11         GC Daemon                         system                 2          TIMED_WAITI 0          0:0        false       true
Memory                       used      total     max      usage     GC
heap                         59M       223M      1820M    3.26%     gc.ps_scavenge.count              118
ps_eden_space                14M       114M      668M     2.11%     gc.ps_scavenge.time(ms)           1890
ps_survivor_space            6M        6M        6M       96.08%    gc.ps_marksweep.count             5
ps_old_gen                   39M       103M      1365M    2.86%     gc.ps_marksweep.time(ms)          1140
nonheap                      234M      240M      0M       97.46%
code_cache                   46M       47M       240M     19.49%
metaspace                    167M      172M      0M       97.36%
Runtime                                                             Tomcat
os.name                           Mac OS X                          connector                         http-bio-8080
os.version                        10.10.5                           QPS                               0.00
java.version                      1.8.0_60                          RT(ms)                            1.13
java.home                                                           error/s                           0.00
                                                                    received/s                        0B
systemload.average                3.44                              sent/s                            0B
processors                        4                                 threadpool                        http-bio-8080
uptime                            16020s                            busy                              0
Specification
- ID: thread ID in JVM (this is different from the nativeID in thread dump)
- NAME: thread name
- GROUP: group the thread is in
- STATE: the current state of the thread
- PRIORITY: within 1 ~ 10 (the higher the number, the higher the priority)
- CPU%: CPU usage ratio within 100ms
- TIME: total running time in minute:second format
- INTERRUPTED: the thread interrupted state
- DAEMON: is daemon thread or not
Screenshots