profiler
Generate a flame graph using async-profiler
The profiler command supports generate flame graph for application hotspots.
The basic usage of the profiler command is profiler action [actionArg]
Start profiler
$ profiler start
Started [cpu] profiling
By default, the sample event is
cpu. Can be specified with the--eventparameter.
Get the number of samples collected
$ profiler getSamples
23
View profiler status
$ profiler status
[cpu] profiling is running for 4 seconds
Can view which event and sampling time.
Stop profiler
Generate svg format results
$ profiler stop
profiler output file: /tmp/demo/arthas-output/20191125-135546.svg
OK
By default, the generated results are saved to the arthas-output directory under the application’s working directory. The output result path can be specified by the --file parameter. such as:
$ profiler stop --file /tmp/output.svg
profiler output file: /tmp/output.svg
OK
Generating html format results
By default, the result file is svg format. If you want to generate the html format, you can specify it with the --format parameter:
$ profiler stop --format html
profiler output file: /tmp/test/arthas-output/20191125-143329.html
OK
Or use the file name name format in the --file parameter. For example, --file /tmp/result.html.
View profiler results under arthas-output via browser
By default, arthas uses port 3658, which can be opened: http://localhost:3658/arthas-output/ View the arthas-output directory below Profiler results:
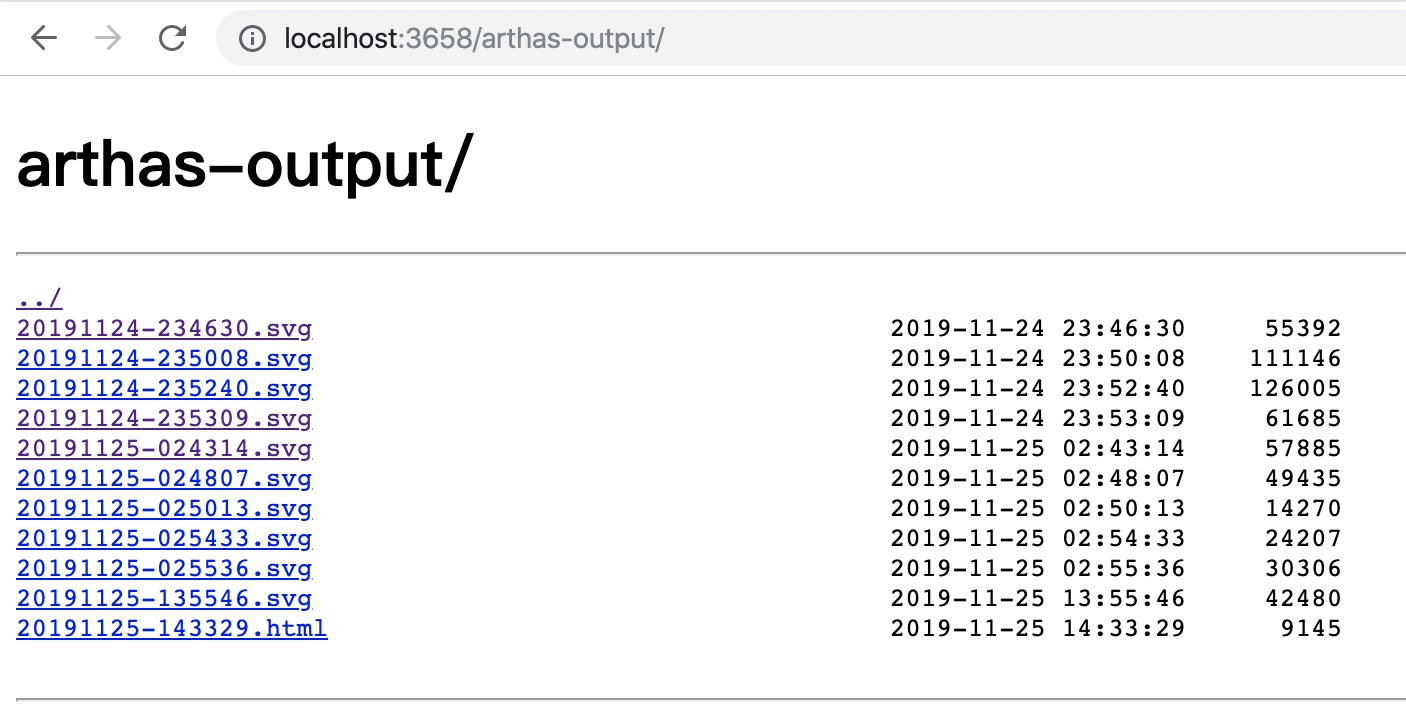
Click to view specific results:
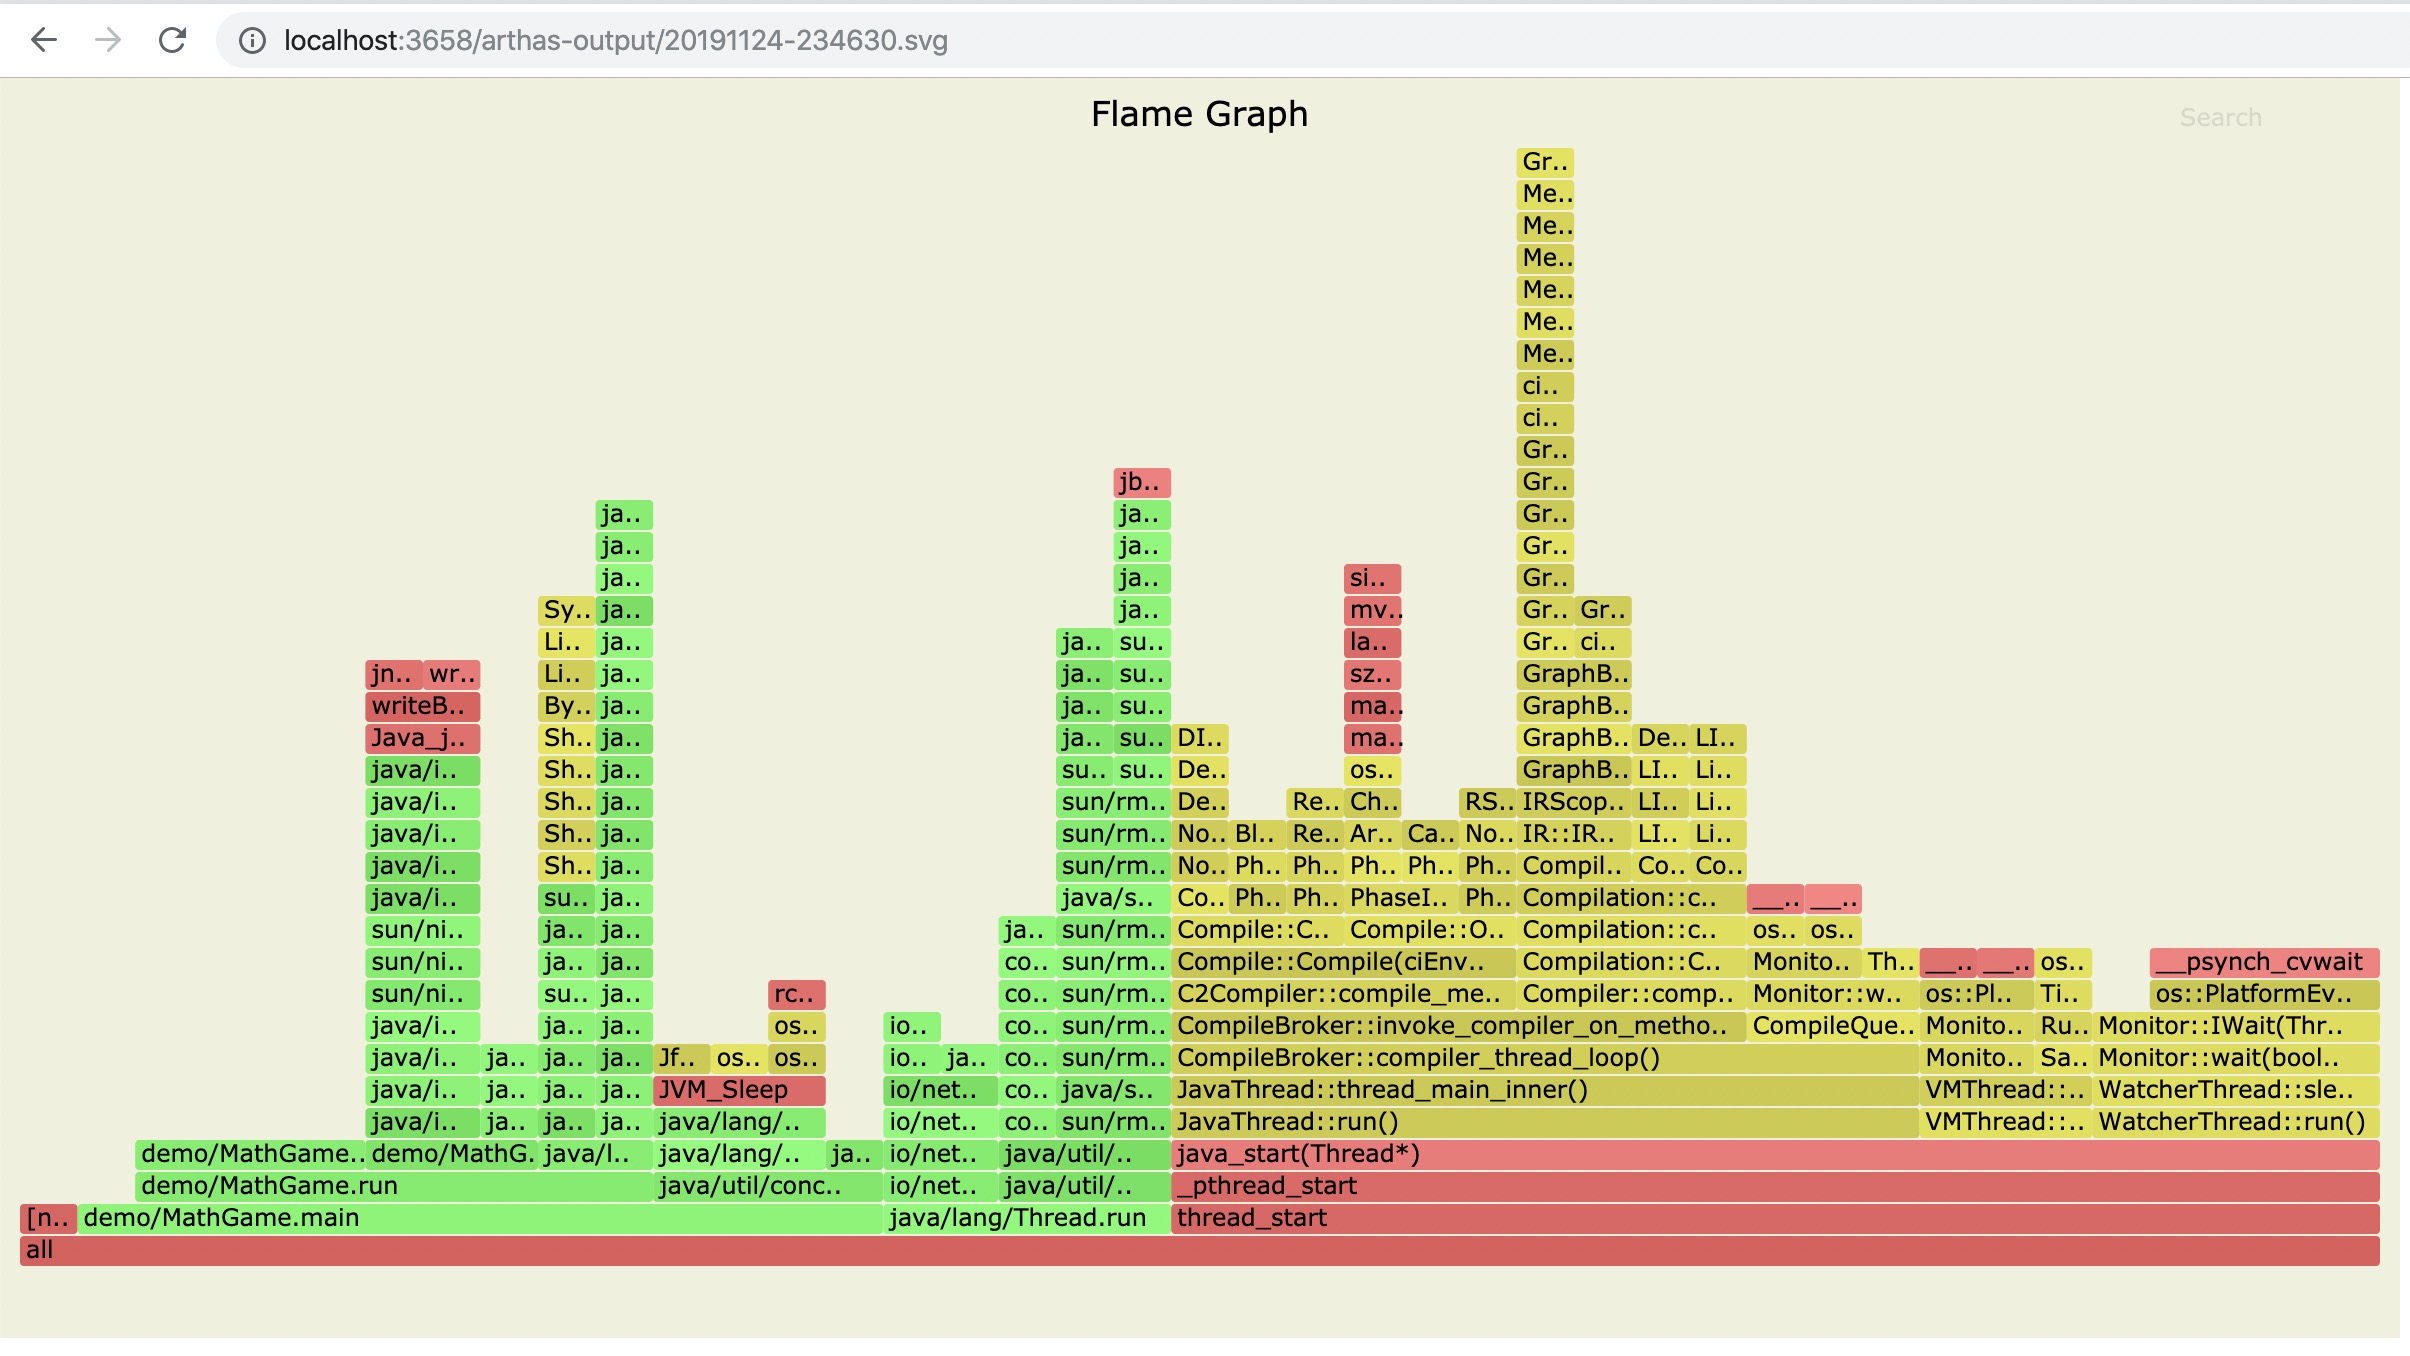
If using the chrome browser, may need to be refreshed multiple times.
Profiler supported events
Under different platforms and different OSs, the supported events are different. For example, under macos:
$ profiler list
Basic events:
  cpu
  alloc
  lock
  wall
  itimer
Under linux
$ profiler list
Basic events:
  cpu
  alloc
  lock
  wall
  itimer
Perf events:
  page-faults
  context-switches
  cycles
  instructions
  cache-references
  cache-misses
  branches
  branch-misses
  bus-cycles
  L1-dcache-load-misses
  LLC-load-misses
  dTLB-load-misses
  mem:breakpoint
  trace:tracepoint
If you encounter the permissions/configuration issues of the OS itself and then missing some events, you can refer to the async-profiler documentation.
You can use the --event parameter to specify the event to sample, such as sampling the alloc event:
$ profiler start --event allocResume sampling
$ profiler resume
Started [cpu] profiling
The difference between start and resume is: start is the new start sampling, resume will retain the data of the last stop.
You can verify the number of samples by executing profiler getSamples.
Use execute action to execute complex commands
For example, start sampling:
profiler execute 'start'Stop sampling and save to the specified file:
profiler execute 'stop,file=/tmp/result.svg'Specific format reference: arguments.cpp#L34
View all supported actions
$ profiler actions
Supported Actions: [resume, dumpCollapsed, getSamples, start, list, execute, version, stop, load, dumpFlat, actions, dumpTraces, status]
View version
$ profiler version
Async-profiler 1.6 built on Sep  9 2019
Copyright 2019 Andrei Pangin